Average Airbnb Occupancy Rate in Maine, by Market
Maine vacation rentals do not all earn the same way. Here is what AirDNA's latest data shows about occupancy rates across 24 Maine markets, from Bar Harbor's 75.6% peak to the ski-country dip, and what those numbers mean for your bottom line.
Why Occupancy Is the Number You Should Watch
Most short-term rental conversations start with nightly rate. Owners want to know how much their Airbnb can charge, and that is a fair question. But after a decade of providing professional vacation rental management in Maine, we will tell you the number that actually decides whether a rental hits its potential is occupancy.
Occupancy is the lever you have the most influence over. Your nightly rate is constrained by your market and your home’s features. Your occupancy depends on pricing strategy, listing quality, photography, response speed, review velocity, and a dozen operational decisions made every week. A property that runs at 70% occupancy at $400/night earns far more than one at 50% occupancy at $500/night, and the high-occupancy property is doing the harder work behind the scenes.
So let us look at what occupancy actually looks like across Maine right now.
THE BOTTOM LINE
Across 24 Maine vacation rental markets, the median Airbnb occupancy ranges from 36.5% in remote western Maine to 75.6% in Bar Harbor. Greater Portland and the Mid-Coast hold the most consistent mid-60s performance year-round. Ski-country markets like Bethel and Sugarloaf run 10 to 20 percentage points below the coast because their demand is concentrated in just three or four months. Source: AirDNA Enterprise API, last twelve months.
The Top 10 Maine Markets by Median Occupancy
These rankings come from AirDNA’s listing-level data for active short-term rentals within a tight radius of each market center. We sampled comparable entire-home listings across 1 to 5 bedroom sizes and report the median occupancy rate among the active comp set.
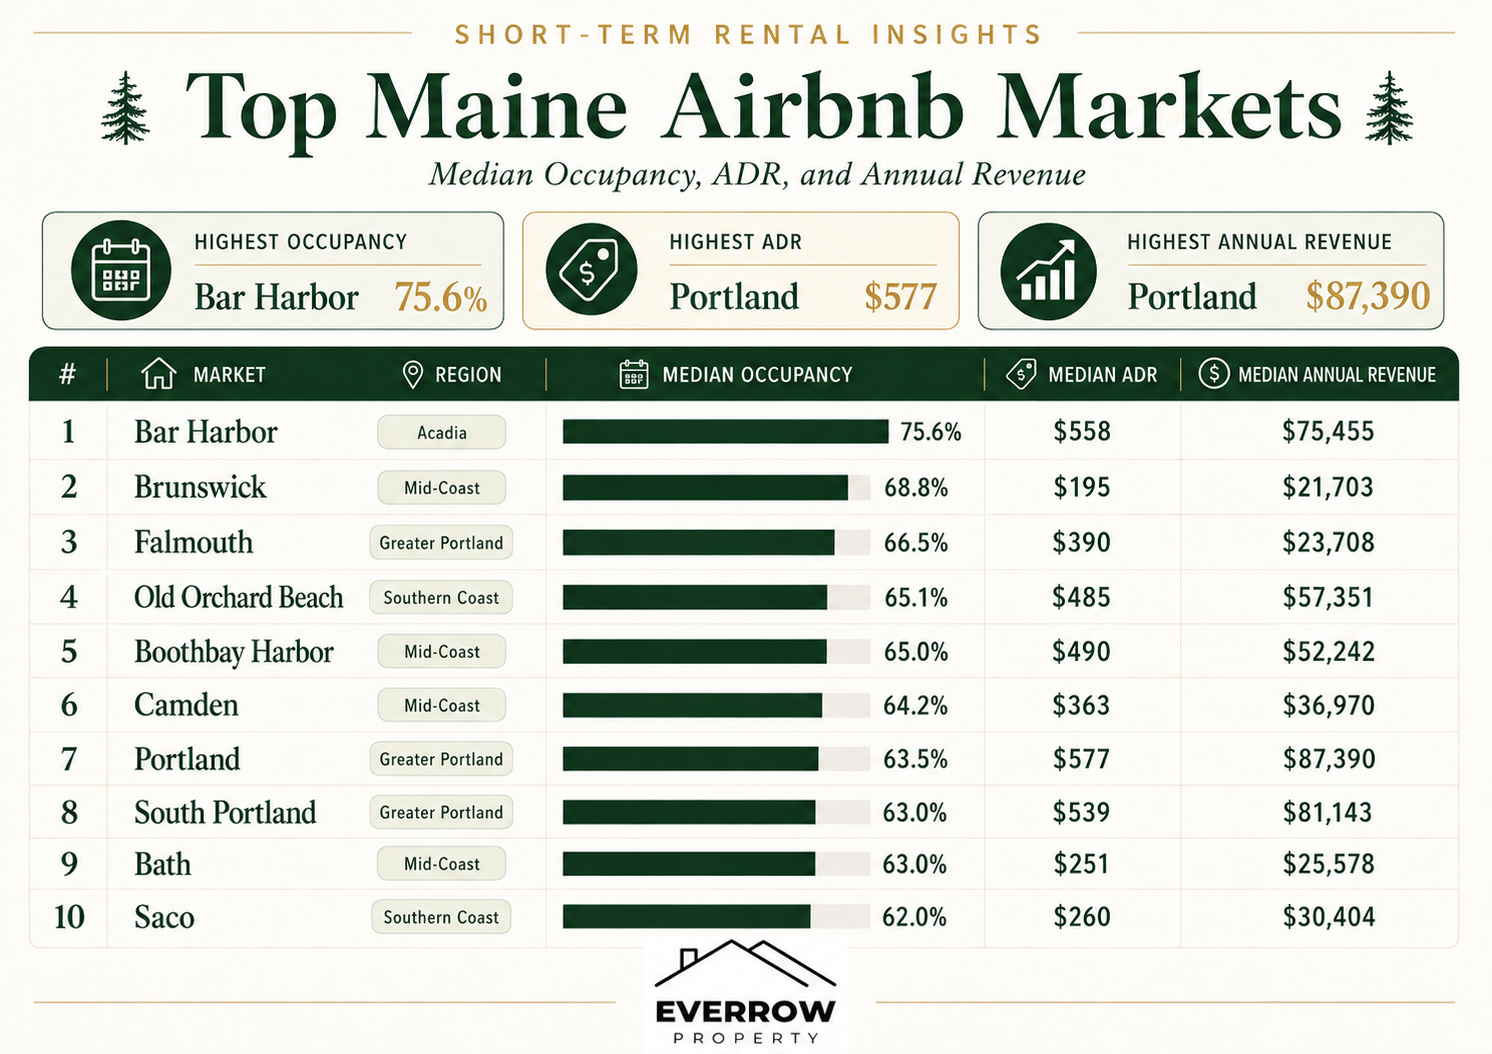
| Rank | Market | Region | Median Occupancy | Median ADR | Median Annual Revenue |
|---|---|---|---|---|---|
| 1 | Bar Harbor | Acadia | 75.6% | $558 | $75,455 |
| 2 | Brunswick | Mid-Coast | 68.8% | $195 | $21,703 |
| 3 | Falmouth | Greater Portland | 66.5% | $390 | $23,708 |
| 4 | Old Orchard Beach | Southern Coast | 65.1% | $485 | $57,351 |
| 5 | Boothbay Harbor | Mid-Coast | 65.0% | $490 | $52,242 |
| 6 | Camden | Mid-Coast | 64.2% | $363 | $36,970 |
| 7 | Portland | Greater Portland | 63.5% | $577 | $87,390 |
| 8 | South Portland | Greater Portland | 63.0% | $539 | $81,143 |
| 9 | Bath | Mid-Coast | 63.0% | $251 | $25,578 |
| 10 | Saco | Southern Coast | 62.0% | $260 | $30,404 |
A few things to notice before we get into the regional breakdown. First, Bar Harbor is in a category of its own. Acadia National Park’s gravitational pull means the typical rental is booked for three out of every four nights, which is extraordinary for a market with such intense seasonality. Second, Brunswick punches above its weight. It does not have the coastal glamour of Camden or the Kennebunks, but Bowdoin College, the former naval base footprint, and steady Mid-Coast tourism keep occupancy higher than every beach town we measured.
Third, Portland’s revenue dominates. Even at 63.5% occupancy, which is lower than the table-toppers, Portland’s $577 median ADR drives $87k in median annual revenue, the highest of any market on the list. That is a useful reminder that occupancy is one variable in the income equation, not the whole story.
How the Six Regions Stack Up
Acadia and Down East: 75.6% median. Bar Harbor is the only market we sampled here, but it sets the ceiling for the state. Demand from Acadia visitors is so concentrated and so reliable that occupancy stays strong even at a $558 nightly rate.
Mid-Coast: 65.4% region-wide median. Brunswick (68.8%), Boothbay Harbor (65.0%), Camden (64.2%), and Bath (63.0%) form the most consistent regional cluster. The Mid-Coast benefits from a longer shoulder season than the southern beach towns and a more diversified visitor mix that includes sailing, leaf-peeping, day-trips from Portland, and weekend wedding traffic.
Greater Portland: 64.3% region-wide median. Falmouth’s 66.5% leads the area, with Portland and South Portland close behind in the low 63s. This region’s edge is year-round demand: business travelers, food tourism, weekend visitors, and a slowly growing winter market mean Greater Portland properties do not suffer the deep off-season trough that plagues seasonal markets.
Southern Coast: 60.0% region-wide median. Old Orchard Beach (65.1%) and Saco (62.0%) sit on top because they are close enough to Portland to capture year-round overflow. Wells (61.1%), Ogunquit (60.3%), and York (59.8%) cluster tightly. Kennebunkport is the outlier we will explain below.
Lakes Region: 55.7% region-wide median. Sidney (60.7%), Bridgton (55.7%), Belgrade Lakes (55.6%), Sebago Lake (55.1%), and Greenville (51.4%) all reflect the same pattern: a packed summer and a quiet winter. Properties here can be excellent investments, but they require seasonal pricing discipline.
Western Mountains: 45.9% region-wide median. Newry (51.7%), Bethel (50.3%), Rangeley (46.5%), Carrabassett Valley (44.6%), and Greenwood (36.5%) are the most seasonal markets in the state. Ski demand is intense from December through March and again briefly in October foliage, but the shoulders are deep. Sunday River and Sugarloaf properties can be great earners. They just earn that money in concentrated bursts.
The Kennebunkport Paradox
Kennebunkport surprises a lot of owners. With a 55.8% median occupancy, it sits below every other Southern Coast market we measured, and yet it produces the highest median annual revenue of the beach towns at $69,340. How?
Two things. First, Kennebunkport’s premium positioning supports a $533 median ADR. Owners there charge for what the location is worth, not for what gets the calendar full. Second, fewer-but-more-valuable bookings is often the right strategy in luxury markets. Chasing occupancy through aggressive discounting would erode the brand of the property and trade $700 nights for $400 ones.
The takeaway: do not index purely on occupancy. A 55% market that runs at premium ADR can out-earn a 70% market at mid-tier ADR. The right number to watch is revenue per available night (RevPAN), which our team calculates as part of every property review.
What This Means for Your Property
Owners often ask us why their property’s occupancy is not matching their market’s median. Usually the answer is one of four things: pricing strategy is not tuned to the seasonality, photography and listing copy are not earning the click-through they could, guest response and review velocity are slow, or the calendar is not being managed across multiple platforms (Airbnb, Vrbo, direct).
A market median is only meaningful in context. A well-managed Acadia rental should beat 75.6%. A poorly-managed Carrabassett condo can underperform 44.6% in a market that is already tough. The gap between a median property and a top-quartile property in the same market is regularly 20+ percentage points of occupancy, which compounds directly into your annual revenue.
If you are curious where your home should land, run your address through our free projection tool. It pulls live AirDNA comps for your specific location and bedroom count and shows you both market median and Everrow-projected performance side by side. If the gap looks big, we should talk.
Methodology note: Data sourced from AirDNA Enterprise API (POST /listing/comps/area) on May 30, 2026. For each market we queried entire-home active comps within 5 to 15 km of the market center, across 1 to 5 bedroom sizes, and aggregated the trailing-twelve-month occupancy rate, average daily rate, and revenue per active listing. Sample sizes range from 29 to 125 listings per market. Reported figures are medians, which we prefer to means for rental data because of the long upper tail in revenue.
Find out what your Maine property could earn.
Our revenue team builds a custom projection for your home using comparable rentals, seasonal demand, and the operational levers most owners overlook. No obligation, no high-pressure follow-up.